i2 iBase dashboards with PowerBI – Unlock your data

iBase and PowerBI - Unlock your data

Who doesn’t love a good dashboard? What better way to gain a high-level understanding of your data than to see it come alive in bright colours before your eyes? They’re great for presentations but can also give valuable insights into where the peaks and troths in your data lie. From an analytical perspective, it can give you a starting point for your analysis; which with large datasets is very useful.

Dashboards need data. i2 users will store most of their data in iBase; which is very sensible. They do this because items can be quickly retrieved using the intuitive search tools, while the details and hidden connections are easily drilled down upon using i2 Analyst’s Notebook.

It is not always possible, or indeed sensible to place your entire iBase database onto an Analyst’s Notebook chart.

So i2 users have the data, they also have the ability to drill down into the detail. What they sometimes lack is the high-level statistics that a dashboard can provide.

Analyst’s Notebook – Bar Charts and Histograms

One way of doing this is to use the Bar Charts and Histograms functionality within Analyst’s Notebook. This functionality has proven itself very popular as it provides interactive statistical information. The only limitation to this functionality is: it only works with data that is on an Analyst’s Notebook Chart. Statistical information works best with lots of data and it is not always possible, or indeed sensible to place your entire iBase database onto an Analyst’s Notebook chart.

PowerBI

Power BI is a dashboard and reporting analytics tools that can connect to existing data sources and deliver insights that might otherwise have been missed. It allows its users to produce beautiful, interactive reports and then publish them for your organization to consume.

The example below shows national crime information. The data (although fake) is being held in an iBase database. The dashboard shows a location heat map (top left), number of crimes by type (top right), crimes by ward (bottom left) and crimes by date (bottom right).

PowerBI Crime Type Dashboard

PowerBI is interactive, meaning a user can drill down into a specific area of the data. In the example below a user has concentrated on pedal cycle crime.

PowerBi Pedal Crime Dashboard

From here the user can glean insights into this crime type. They can see the areas of the country that have the most pedal cycle crime. The time of the year which it most occurs (July to October) and which wards are most affected (Thames Valley Police and Cambridgeshire).

This can assist with strategic planning. If tasked with reducing pedal bike crime, a team could concentrate on university towns (Thames Valley and Cambridgeshire both hold large universities) between the date ranges of July to October.

What’s the catch?

In order to use iBase data with PowerBI you need a good understanding of your iBase security set-up and the underlying table structure; both of which S-branch can help you with. Regarding costs, the desktop version of PowerBI is free; yes free. This allows users to produce dashboards locally. Most organisations will choose a paid for package where they publish dashboards other colleagues within their organisation. To view a published dashboard all that is needed is a web browser.

For more information on PowerBI, visit the website here. For information on how to integrate it with your iBase implementation (new or old) please contact us

Visallo – plug and play cognitive technology

VisalloCognitive

Cognitive Technology

In its simplest form, cognitive technology is software mimicking the human brain. A human brain can read text, listen to sound and spot objects in videos. A human brain understands context, it can learn from previous experience and it can adapt as new information comes its way. In short: the human brain is brilliant. Why would we use anything else?

Well, we are in an age of data generation. On average users of the Internet generate 2.5 quintillion bytes of data each day. It’s not just reserved for the Internet either, companies are generating more internal data than ever and as storage becomes cheaper the data only grows.

The key to a company’s success may be hidden in their own data. The meaning of life may well be held on the Internet; you never know.

With this newly acquired data comes great opportunity. The key to a company’s success may be hidden in their own data. The meaning of life may well be held on the Internet; you never know. The problem of course is the sheer volume. The task of understanding the data and obtaining anything useful from it is impossible to do manually; although I’ve seen people try!

This is where cognitive technology comes in. Forms of artificial Intelligence, computer vision, machine learning, natural language processing and speech recognition; that can be used to understand the data for us. It is only then that we can then gain intelligence from the huge amount of data. All that is needed is an analytics system with cognitive technology…

All that is needed is an analytics system with cognitive technology…

Build your own

One option is to build a system from scratch.  By cherry picking the best technology companies (as well as open source resources) that provide cognitive analytics. You could feed data to and from these technologies into the system. You could pick a high-performance graph database to deal with the data and build a cutting edge browser-based UI to give statistical and visual analytics to the users.

This option is a viable but costly one. It will require a good solutions architect who understands the problem, some high-end developers, a data scientist and a project manager. It’s also a time-consuming proposition. You aren’t going to be getting results tomorrow.

Off-the-shelf

Why build something when somebody else has already developed it? Another option is to buy an ‘off the shelf’ solution. Here the deployment will be fast, you will get support when you get stuck and the UI and back end database have already been thought through.

This option is appealing and may be cheaper. It is common though that you are then tied in to any technology that the software vendor has partnered with. This may mean: if you want improved voice recognition or natural language processing in Arabic, you may not find the solution you want.

Visallo – Plug ang Play Cognitive Technology

Visallo is one of the ‘off the shelf’ solutions described above. It is based on a high-performance graph database and it allows users to perform: statistical, visual (graph), temporal and geo-spatial analysis all from one intuitive browser-based UI.

Visallo

Visallo

While that is all appealing, the interesting part to Visallo is their attitude to extension and customization. They actively encourage it. Jeff Kunkle, the President of Visallo actually wrote a blog entitled ‘We love when customers replace our software’

Visallo was designed with extension and customization in mind. From the underlying data store to data processing algorithms and UI plugins, you’re not stuck with a one-size-fits-all solution.

This means if the default OpenNLP plug-in that analyses text and extracts entities (People, Organisations, Locations and Vehicles) from unstructured data doesn’t fit your needs; choose another one. If you want to integrate with you existing investment in voice recognition technology; no problem.

analyticplugin

Plug and Play

This attitude to ‘plug and play’ technology allows the fast deployment and support of an off-the-shelf product, with the flexibility of a build-your-own solution.

For more information on Visallo visit their website or contact S-branch to find out more. If you’d like to find out more about cognitive technologies and the application into crime and fraud; feel free to call.

S-branch offers independent advice, so even if Visallo is not for you, we can help you find the solution that is.

Tackling duplicate data in i2

Smart Matching

Duplicates in data is always an issue. An issue which is magnified once you start trying to load said data into a visual analysis tool like i2. The nature of tools like i2 is that they find connections between entities; in order for that to work the data must be clean a free of duplicates.

In reality, it’s not always feasible or realistic to get rid of all duplicates. For this reason, the i2 analysis suite does provide some matching functionality

Smart Matching – i2 Analyst’s Notebook

To explain it in a simple way: Smart matching in analyst’s notebook is achieved by categorising entities and applying almost human matching logic.

For example, a visualisation may contain a police officer, a victim, a suspect, a prisoner, a male and a female entity. These entities could all be categorised as People. As humans, we could look at a list of people and would instinctively apply matching logic. We’d know that date of birth was important. As are surnames, although they may change when someone marries. We know that Chris could be spelt in several different ways and (as with any data) there may be spelling mistakes.

i2 smart matching can do the same thing. It will apply a different set of logic to different categories of entities to give an almost human matching ability.

Smart matching example

Smart matching example

Great! Problem solved! Well yes, if you have a smallish set of data then smart matching will work well. However, for smart matching to work, the entities need to be on an analyst’s notebook chart. This may start becoming an issue once you hit the 20,000 entities mark! You could try some kind of batching process but it’s likely to be time-consuming and not entirely accurate.


Matching in iBase

Matching in iBase example

Matching in iBase example

iBase will not have this problem. Being a database it will have access to all of your records without needing to render them on a visual chart. The problem we have in iBase is it doesn’t have access to the same smart matching logic. With iBase we can match someone with exactly the same surname. Or, the exact same surname and date of birth. While useful, this will miss a lot of duplicates and therefore needs to be used with care.

Custom Matching Functionality

For some of our clients, the functionality described above didn’t meet their needs. They either had too many entities or wanted to find duplicates of completely different entity types, or maybe over different databases.

For these clients s-branch developed an external matching solution, using an existing string matching theory called Levenshtein distance. Levenshtein distance is a string metric for measuring the difference between two sequences. Informally, the Levenshtein distance between two words is the minimum number of single-character edits (insertions, deletions or substitutions) required to change one word into the other. What’s great about using Levenshtein distance is that it gives us a score. Meaning we can see narrow down our results to only the most relevant matches.

Custom matching example

Custom matching example

The external matching is computed outside of iBase. This is done to minimalise the effect on database performance but also allows us to iterate through entire datasets programmatically. This means we can compare duplicates regardless of whether they are the same entity type; or even the in the same database. The output from this is a matching score which is then imported into iBase as a ‘AutoMatch’ link. Our clients can then use existing iBase functionality, such as queries and sets to review the matches found and if applicable merge them through the normal UI.

You can read more on Levenshtein distance here.  To find out more about using Levenshtein distance with iBase or to discuss your own duplicate problem, please contact us

INTERPOL Firearm Forensics Symposium (IFFS) – 2017

In October 2017 I was asked by Arquebus Solutions to speak at the IFFS, an event designed for individuals who investigate firearms-related crimes, heads of police agencies and those who shape policy aimed at combating firearm crime.

It was an honour and a privilege to speak at such an event. It was also fascinating and humbling to hear experts share lessons learned following the recent terrorist attacks in Europe and other parts of the world.

Firearm Focal Points

One point which was consistent throughout the event was Firearm Focal Points (FFPs). FFPs are designed to collect all the necessary firearm information together, creating accurate investigative leads thereby helping both investigators and prosecutors to tackle the problem at source.

Firearm Focal Point

Firearm Focal Point

FFPs work because of data collaboration. Analysis of ballistic evidence has advanced hugely but this information should not be analysed on its own. If a cartridge case is found at a location what other crimes have we seen in that area? Were there any ‘shots fired’ call outs at that time? We may know that the cartridge case comes from a particular type of firearm. What intelligence do we have about trafficking those types of firearms? If we are lucky enough to find or have a match to a particular firearm; who is it registered to? Is there any link to other crimes?

We can only answer these questions if we have access to all the information. Analysis tools allow us to understand this information quickly, helping FFP’s provide accurate leads fast. It was my job to showcase how analysis tools can aid investigations when this data is made available.

Arquebus and I worked together to implement the Kosovo FFP. The success of this deployment was collaborated by Kosovo Police, who also spoke at the conference. It was with great pride that I listened to real cases where the collaboration of ballistic and crime information had aided investigations.

Crime in Action

A unique feature of IFFS 2017 was the ‘Crime in Action’ simulation, which ran through the entire conference. Subject experts shared their experiences and expertise not only through presentations and interactive panel discussions but also as part of a ‘crime in action’ scenario.

IFFS

IFFS

It was great to see all of the skills and expertise employed in dealing with a live gun crime investigation, but also to see how areas such a legislation, policy making, joint working arrangements and international development all play a part in how we deal with gun crime and illicit arms trafficking.

The highlights for me were visiting a simulated gun crime scene and the final arrest which occurred in the middle of the conference, much to the surprise and delight of the delegates.

In summary, it was one of the best conferences I’ve attended and I hope to return either as a delegate or presenter in the future.

Analysing and understanding text

Library

Introduction

Large amounts of text can pose a challenge to analyse and understand. We keep generating more of it every day. This ‘unstructured text’ can be in documents, emails or social media posts. Indexing this text can help when searching for keywords, but what if you don’t know the keywords? What if you don’t know where to start?

This post describes some of the technology and techniques that are available. It focusses on free to use (but not to distribute) software. It will not focus on particular commercial software; although some products are mentioned.

The Data

royal_commission

Case Study 21

The data I’ve used for this is real. A case study from a public inquiry into Satyananda Yoga Ashram at Mangrove Mounting (Australia) for allegations of child sexual abuse. The allegations are made against a spiritual leader Akhandananda in the 1970’s and 1980’s with submissions from survivors, held in multiple documents.

https://www.childabuseroyalcommission.gov.au/case-studies/case-study-21-satyananda-yoga-ashram

WARNING: The content of these documents are disturbing. Reader discretion is advised. 

Natural Language Processing
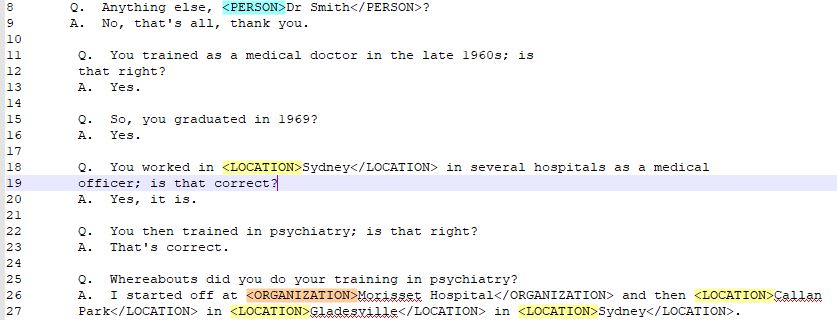
To help understand the data within these documents, I’ve first used Natural Language Processing (NLP). NLP allows machines to ‘read’ unstructured text. One of the ways NLP evaluates a document is: Named Entity Recognition (NER). NER gives an understanding of what entities (for example: people, organisations or locations) are present in the text.

Natural Language Processing

Natural Language Processing (NLP)

To demonstrate NLP I’ve used free software created by Stanford University. There are many other good commercial NLP products on the market offering various language/analytic capabilities.

Statistical Analysis

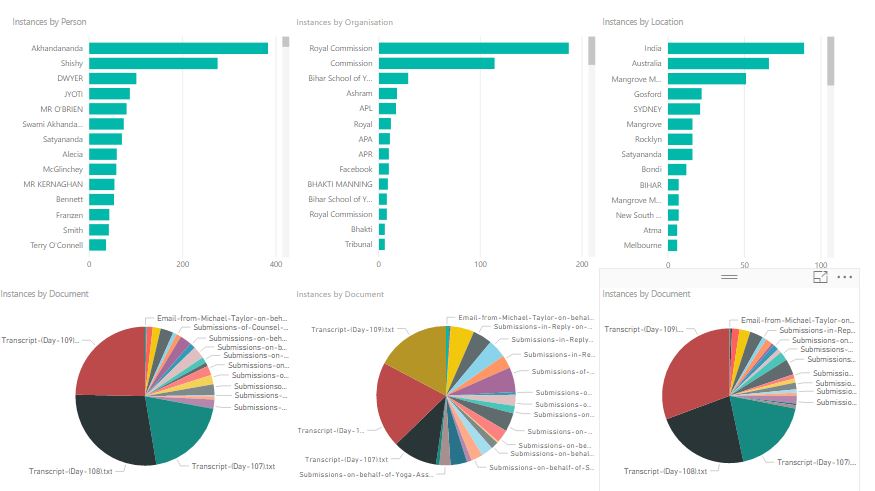
To give meaning to the results of the NLP I’ve summarised the documents and their contents dependant on the entity type. In this example, I’ve stuck with people, organisations and locations. Below is a statistical visualisation.

Statistical - PowerBI

Statistical – PowerBI

For each entity type, a count of occurrences is shown as well as document coverage. ‘Akhandananda’ is the person that has appeared the most times and the document ‘Transcript – Day 108’ contains the most people.

This basic visualisation was built very quickly using the free version of PowerBI. The free version allows you to create visualisations but limits the sharing options available. There are other good tools available for this kind of analysis, most offer free trials which is great if you want to compare functionality.

Visual Analysis

To take the analysis further I really needed to load the results into a database. I chose a graph database, simply because graph databases perform well with entity data such as people, organisations and locations.

For this example, I’ve loaded my data into Neo4j Community Edition which is free to use (under the GPL v3 license). If I was building something commercial which needed to scale then Neo4J offer commercial licenses as well.

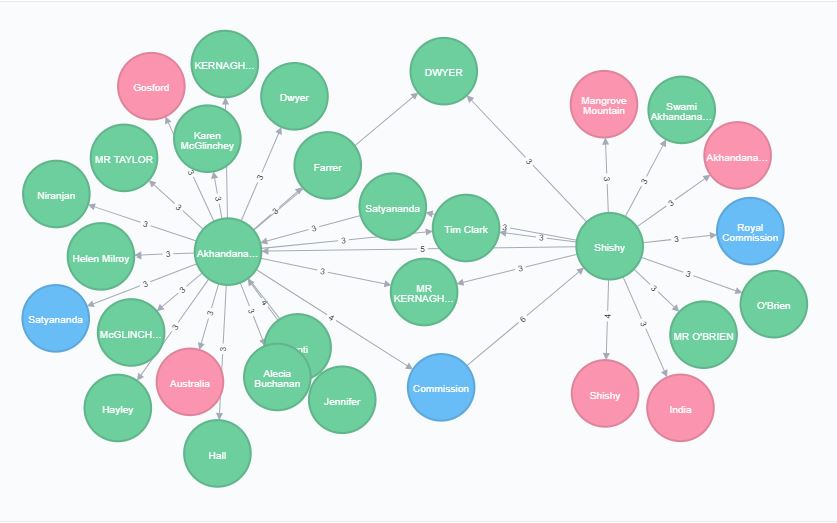
Once modelled, I could easily generate networks uncovering interconnecting entities within the data. The resulting visualisation is based on a short query. People are represented in green, organisations in blue and locations in pink.

Inquiry Network

Inquiry Network

Here we can see that Akhandananda and Shishy are key entities, mentioned alongside a lot of other entities. We can also see that Commission, Satyananda, Tim Clark, DWYER etc are linked to both Akhandananda and Shishy. These now become entities of interest.

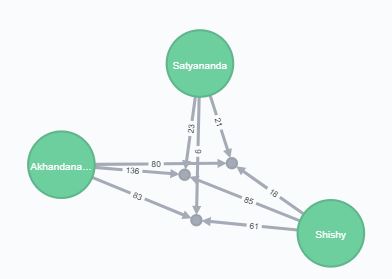
This gives a place to start. I first concentrated on Satyananda. Satyananda is a complicated entity as it’s the name of an individual and also the Yoga organisation. In this case, NLP has pulled out Satyananda the person. I used Neo4J to drill down into these entities, showing three documents that all entities were linked to. This time the numbers on the links refer to the occurrences of that entity in that document.

Document Network

Document Network

A quick look through those three documents soon shows Satyananda, Akhandananda and Shishy being mentioned together multiple times. The subject matter is disturbing, so I’ve chosen the text carefully. Below is a screenshot where Shishy is mentioning both Satyananda (as a person) and Akhandananda when being questioned.

Highlighted Text

Highlighted Text

Summary
Using a mixture of NLP, statistical and visual analysis tools allowed me to very quickly narrow down which documents and entities are of interest.

In truth, with a small dataset like this (under 40 documents) reading each document manually is another valid option. NLP is also not completely accurate and cannot fully replace the human touch. If faced with 1000 + documents then techniques like above can really help direct analysts to the key information.

This is a demonstration only and focusses on freely available tools. There are many commercial offerings that offer the functionality described above (and more) in one seamless application. If you are looking for fraud or crime in unstructured text then S-branch can help guide you to the appropriate products available.