
Analysing and understanding text

Introduction
Large amounts of text can pose a challenge to analyse and understand. We keep generating more of it every day. This ‘unstructured text’ can be in documents, emails or social media posts. Indexing this text can help when searching for keywords, but what if you don’t know the keywords? What if you don’t know where to start?
This post describes some of the technology and techniques that are available. It focusses on free to use (but not to distribute) software. It will not focus on particular commercial software; although some products are mentioned.
The Data

Case Study 21
The data I’ve used for this is real. A case study from a public inquiry into Satyananda Yoga Ashram at Mangrove Mounting (Australia) for allegations of child sexual abuse. The allegations are made against a spiritual leader Akhandananda in the 1970’s and 1980’s with submissions from survivors, held in multiple documents.
https://www.childabuseroyalcommission.gov.au/case-studies/case-study-21-satyananda-yoga-ashram
WARNING: The content of these documents are disturbing. Reader discretion is advised.
Natural Language Processing
To help understand the data within these documents, I’ve first used Natural Language Processing (NLP). NLP allows machines to ‘read’ unstructured text. One of the ways NLP evaluates a document is: Named Entity Recognition (NER). NER gives an understanding of what entities (for example: people, organisations or locations) are present in the text.
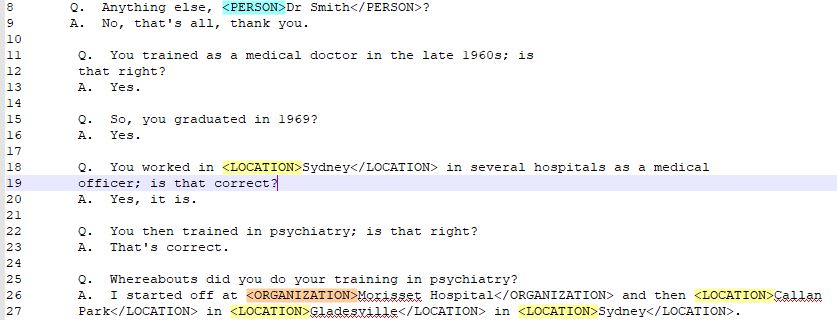
Natural Language Processing (NLP)
To demonstrate NLP I’ve used free software created by Stanford University. There are many other good commercial NLP products on the market offering various language/analytic capabilities.
Statistical Analysis
To give meaning to the results of the NLP I’ve summarised the documents and their contents dependant on the entity type. In this example, I’ve stuck with people, organisations and locations. Below is a statistical visualisation.
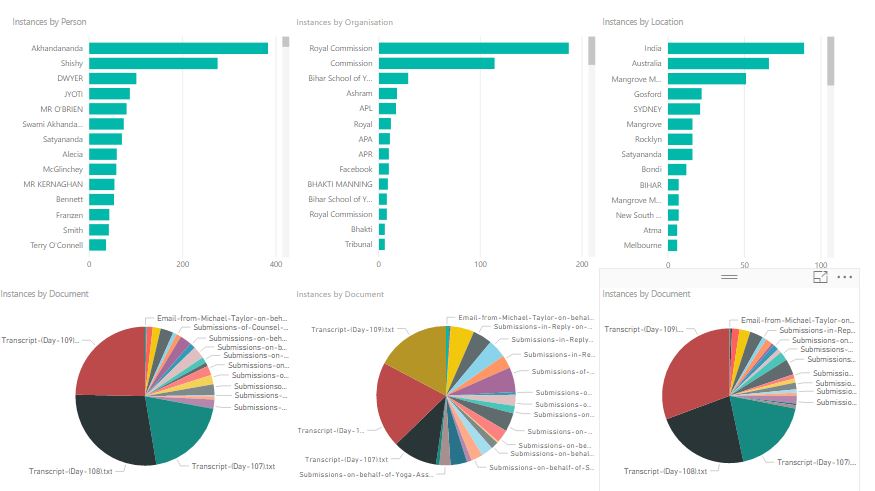
Statistical – PowerBI
For each entity type, a count of occurrences is shown as well as document coverage. ‘Akhandananda’ is the person that has appeared the most times and the document ‘Transcript – Day 108’ contains the most people.
This basic visualisation was built very quickly using the free version of PowerBI. The free version allows you to create visualisations but limits the sharing options available. There are other good tools available for this kind of analysis, most offer free trials which is great if you want to compare functionality.
Visual Analysis
To take the analysis further I really needed to load the results into a database. I chose a graph database, simply because graph databases perform well with entity data such as people, organisations and locations.
For this example, I’ve loaded my data into Neo4j Community Edition which is free to use (under the GPL v3 license). If I was building something commercial which needed to scale then Neo4J offer commercial licenses as well.
Once modelled, I could easily generate networks uncovering interconnecting entities within the data. The resulting visualisation is based on a short query. People are represented in green, organisations in blue and locations in pink.
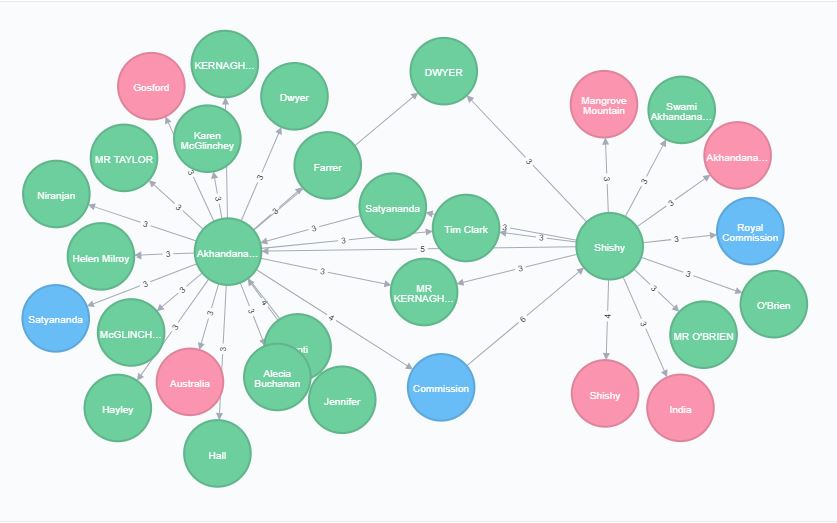
Inquiry Network
Here we can see that Akhandananda and Shishy are key entities, mentioned alongside a lot of other entities. We can also see that Commission, Satyananda, Tim Clark, DWYER etc are linked to both Akhandananda and Shishy. These now become entities of interest.
This gives a place to start. I first concentrated on Satyananda. Satyananda is a complicated entity as it’s the name of an individual and also the Yoga organisation. In this case, NLP has pulled out Satyananda the person. I used Neo4J to drill down into these entities, showing three documents that all entities were linked to. This time the numbers on the links refer to the occurrences of that entity in that document.
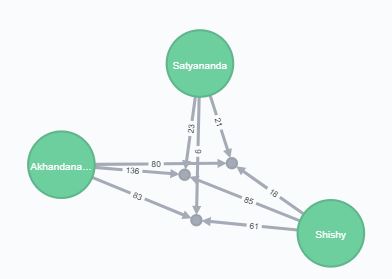
Document Network
A quick look through those three documents soon shows Satyananda, Akhandananda and Shishy being mentioned together multiple times. The subject matter is disturbing, so I’ve chosen the text carefully. Below is a screenshot where Shishy is mentioning both Satyananda (as a person) and Akhandananda when being questioned.

Highlighted Text
Summary
Using a mixture of NLP, statistical and visual analysis tools allowed me to very quickly narrow down which documents and entities are of interest.
In truth, with a small dataset like this (under 40 documents) reading each document manually is another valid option. NLP is also not completely accurate and cannot fully replace the human touch. If faced with 1000 + documents then techniques like above can really help direct analysts to the key information.
This is a demonstration only and focusses on freely available tools. There are many commercial offerings that offer the functionality described above (and more) in one seamless application. If you are looking for fraud or crime in unstructured text then S-branch can help guide you to the appropriate products available.