ChatGPT and Bard analyse: Dickens – A Christmas Carol

A Christmas Carol

S-branch traditionally shares a festive message with its followers during the holiday season. Last year, we treated you to a bloopers video from our self-paced online training course, “i2 Analyst’s Notebook – Creating Charts.” This year, we aim to infuse a bit more holiday spirit while highlighting the impactful work undertaken at S-branch.

This year I set myself the task of analysing: Charles Dickens – A Christmas Carol, using nothing more than a browser, a text editor and freely available online tools.

Back in 2018, I wrote a blog post about analysing and understanding unstructured text. It focussed on using a freely available Natural Language Processing tool to process and analyse some online documents. I then used PowerBI and Neo4J to explore this data further. Things have moved on since then, including the biggest and most hyped technology of the last 12 months: AI Chatbots. ChatGPT was released in November 2022, if you’re anything like me, you will have been using it ever since. This year I set myself the task of analysing: Charles Dickens – A Christmas Carol, using nothing more than a browser, a text editor and freely available online tools.

Desired Result

The question I want to ask is: “Who are the characters and how are they linked together?” I wanted to answer the question using Network Analysis Visualisation. Remember, I can only use freely available online tools. I chose Gephi which is a visualisation and exploration software for all kinds of graphs and networks, it’s also open-source and free. Gephi also provides a lightweight browser version called Gephi Lite, which I chose to use.

Gephi Lite comes with a few example graph files. One example is a character analysis of Les Miserables. I took this as inspiration. I wanted to achieve something similar without a) reading the Dickens book myself and b) writing a line of code.

Bard

To gather the necessary data, I turned to Google’s experimental tool, Bard. Despite its experimental status, Bard’s ability to reat and analyse documents proved invaluable. I pointed Bard at this text and started asking questions.

Bard reading the document

Bard was able to tell me which characters appeared in which chapters, I then asked it to put this information into a CSV format. Admittedly Bard initially summarised this information but after a quick clarification, I was able to get the data I wanted. The other great thing about Bard, is it helpfully puts the data into a Google Sheet

Generated CSV
Generating a CSV
Simplified CSV
Simplifying the CSV
Generated Google Sheet

Lastly, I asked Bard to add a column, counting how many times a character appears in a chapter. As before, it generated a Google Sheet for me too.

Adding a count to the CSV.

At this stage, I had the data I needed. I now needed to convert this data into a Gephi format (gexf), that could be opened in Gephi Lite. The gexf format is essentially an XML format, so I’d need to get Bard to generate code. I tried at length to get Bard to generate valid gexf, with no luck. Again, Bard is in an experimental stage and things are improving all the time.

Chat GPT

I switched over to ChatGPT and copied the data from the CSV/Google Sheet. I then asked it to generate the data in a gexf format. It’s worth considering your wording when asking an AI Chatbot to generate code. The resulting code was copied into a text editor (I used NotePad++) and saved as a gexf file. ChatGPT managed to generate a valid gexf file straight away.

ChatGPT generating a gexf file.

The resulting file in Gephi Lite looked very much like the image below. The only addition I made was adding colour to the nodes, Green for Characters and Grey for Chapters. I asked ChatGPT to do this, but on the first attempt it failed (although it did generate a valid gexf). I had to look at the Les Miserables example and “trained” ChatGPT on how to generate colour. It learnt quickly and was able to generate a valid gexf file with colour.

An AI generated gexf file

Gephi allowed me to run a Force Directed layout on the data. It also has a useful feature where highlighting a chapter highlights the related characters.

Focusing on the characters

I wanted to take the analysis a step further and focus on the characters. For this, I returned to Bard. Bard was able to bring back the original CSV, I then asked it to bring the data back in a different way.

Characters mentioned togeather.

I then took this data, copied it into ChatGPT and asked it to generate another Gephi file.

ChatGPT generating a character relationship Gephi chart

The resulting Gephi chart looked very much like the one below. It’s worth noting that I did ask ChatGPT to size each node depending on how many connections it had. While it generated the data well, I had to “train” it to use the correct format. It’s worth mentioning that it managed to generate a valid gexf file every time I asked it!

The final generated Gephi file
“Training” ChatGPT

Summary

Reflecting on this journey, it’s evident how technology has advanced in five years. When I wrote the original post on NLP I had to write code and install Java to get similar results. The example above is silly and perhaps a little oversimplified, but I was surprised how quickly I could get results.

While this exercise explored the potential of using Bard for document analysis, it also revealed concerns about consistency. Repeatedly asking the same question yielded varying responses, raising doubts about its suitability for real-world data analysis. Additionally, sharing sensitive data with any AI chatbot is inherently risky. Therefore, it might be more prudent to utilize ChatGPT’s script generation capabilities on a prepared data format (rather than giving it data) instead. This way, visualization wouldn’t require repeatedly exposing actual data to Bard.

S-branch is a consultancy company focusing on data analytics software and technology, specifically for looking for Fraud and Crime. We offer consultancy on products in this space and have helped a number of our clients get the most out of their data. If you need help with your data or would like to get out of your existing software investment, please contact us.

PowerBI and Clue – Take your analysis to a new level

PowerBI and Clue – Take your analysis to a new level

We are huge fans of PowerBI here at S-branch. If we ever need to get a ‘lie of the land’ with a new set of data, then it’s our go-to tool. Likewise, we’ve utilised data held within analysis databases using PowerBI before, an example can be found here.

One tool that we were keen to try PowerBI on was Clue. Clue is an investigation case management and intelligence platform that enables organisations to build intelligence and quickly manage and progress investigations. We instantly liked Clue. It’s refreshing to see technology that is designed specifically for Investigations. Too often we see people managing investigations using tools not fit for the job. This leads to workarounds and compromises – Not with Clue!

Being a modern application, Clue has its own API (Application Programming Interface). It is with this API that we interrogated the data within Clue using PowerBI.

Clue’s API

Clue’s API documentation can be found on their support site. We found it to be concise and helpful. We were quickly making API calls using the Postman API Platform to test our requests. There are security measures in place that need to be set up before you start using the API, again this was all documented on the support site.

Making Clue data available using Power BI

Clue has a great article about Power BI on their support site, with examples using Power Query. Utilising Power Query meant we could perform additional basic transformations (such as splitting out date/time fields) on the data too.

PowerBI Power Query

The Dashboards

On our test Clue site, we only have a limited amount of data. For this reason, we chose to focus on the Intelligence register.

Intelligence Register Dashboard

In the dashboard above, we bring together temporal (time), network and statistical analysis in one place. We can drill down into the data using any one of these analysis types, using interactive visualisations.

  • The bottom left shows statistics on the intelligence grading (3x5x2) in accordance with the National Intelligence Model
  • The date of the Intelligence can be interrogated either using a slider or by clicking on a specific time period (in this case a month)
  • The network visualisation can be used to spot commonalities between the intelligence records. The green dots show people that have more than one intelligence record linked to them. This method of visualisation proved quite performant, we tested it against some of our other datasets with 10’s of thousands of records and the results were impressive
  • A filter on the network visualisation allows us the ability to focus on the elements that are important to us
  • The righthand side analyses the linked Outcomes, Decisions, Tasks and Events linked to the intelligence.

It’s important to mention at this point that Clue does have its own dashboard and network analysis capability. PowerBI builds on this ability by having all this information in one place with an interactive dashboard.

Clue is used to tackle threats including counter economic crime, cybercrime, organised crime, corruption, counter-terrorism, environmental crime, human trafficking, counter extremism, drug crime, sexual and violent crime, and hate crime.

If any of the above could benefit you or you’re looking into data analysis tools in general; please feel free to contact us. For more information on Clue, please visit their website

Who ya gonna call? A Forensic Accountant…

Forensic Accounting Software

A lot of people won’t know what a forensic accountant is. I didn’t. It was only when I started working with a team of them at a prestigious accountancy firm that I really got to appreciate the importance of the role and the people that do it.

A forensic account is someone who applies accountancy skills to investigate financial discrepancies and inaccuracies. These investigations will be used to find fraudulent activity, financial misrepresentation or even misconduct.

There is one word I would use when describing forensic accountants and that is versatile

Who ya gonna call?

The truth is a forensic accountant could be useful to a lot of us.

If you run a business, for example, you may believe that there is some internal fraud going on – who ya gonna call? A forensic accountant. You may be about to buy a business and want to know more about its books – who ya gonna call? A forensic accountant.

On a personal level you and your siblings may have been left money or maybe you are going through a divorce and believe money is being hidden from you. That’s right, a forensic accountant can help with these things.

Business evaluations, tax audits, insurance term reviews, stolen paper records; there are a lot of situations where a forensic accountant can help.

Skills

There is one word I would use when describing forensic accountants and that is versatile. I’ve seen them successfully deal with sporadic and often unhelpful data to help a client. This is due to the diverse range of investigations they may conduct.

Applying technology to help clients make sense of sporadic and often unhelpful data is what S-branch does best.

Alongside obvious structured data sources such as companies house records, a forensic accountant may receive data in all manner of ways: boxes full of documents, ceased laptops or mobile phones, ancient financial records, interview videos and recordings to name but a few.

How S-branch can help

S-branch

Trusted Analytics Consultancy

Applying technology to help clients make sense of sporadic and often unhelpful data is what S-branch does best. S-branch is truly independent and remains software agnostic, ensuring our clients get the best solution for their needs; whether they need forensic accounting software or just somewhere to store their intelligence.

Here are some of the ways S-branch can help forensic accountants.

Visualisation Software

Finding hidden connections between different data sources, whether that be financial transactions or social media, requires a good eye. This becomes especially important when you are trying to ‘follow the money’.

The use of visualisation analysis tools or graph visualisations to understand complex data is now common among analysts. Otherwise unseen connections between data can be identified and drilled down upon with ease. Visualisation tools also offer a clear way to present findings and share results.

Unstructured Data Analysis

Large amounts of text can pose a challenge to analyse and understand. We keep generating more of it every day. This ‘unstructured text’ can be in documents, emails or social media posts. Indexing this text can help when searching for keywords, but what if you don’t know the keywords? What if you don’t know where to start?

Unstructured data analysis software allows machines to ‘read’ unstructured text. This could give an understanding of what entities (for example people, organisations or locations) are present in the text. Some of these tools also extract relationships from the sentences and are even multi-lingual making the initial analysis of large amounts of documents quick and easy.

Visual/Audio Analysis

Manually documenting the content of video and audio files is a time-consuming process. Depending on what you are investigating it may also be an impossible task.

The use of cognitive technology to transcribe or even reference known items held within audio and video content can unlock the intelligence held within this kind of media.

Intelligence Data Stores

Having a secure and audited place to hold intelligence as part of a case is of real importance to a forensic accountant. A place where all details of an investigation can be quickly and accurately searched.

A lot of good data stores use the POLE model (People, Objects, Locations, and Events). By framing data in this way, relationships can easily be captured and explored. Intelligence stores will also hold relevant charts, visualisations or even referenced documents, ensuring everything of relevance is in one place.

Companies House Integration

Companies house is a great free resource where you can get access to company information, current and resigned officers or insolvency information.

Making regular queries of companies house through their website is easy, but taking that information and collaborating it with other data sources can be a manual task which is time-consuming. By integrating this resource alongside your intelligence data store it is easier and quicker to see the full picture.

Are you a forensic accountant? Are the technologies above of interest? Or are you struggling with some other form of data you’ve received? Either way, S-branch would love to help.


INTERPOL Firearm Forensics Symposium (IFFS) – 2017

In October 2017 I was asked by Arquebus Solutions to speak at the IFFS, an event designed for individuals who investigate firearms-related crimes, heads of police agencies and those who shape policy aimed at combating firearm crime.

It was an honour and a privilege to speak at such an event. It was also fascinating and humbling to hear experts share lessons learned following the recent terrorist attacks in Europe and other parts of the world.

Firearm Focal Points

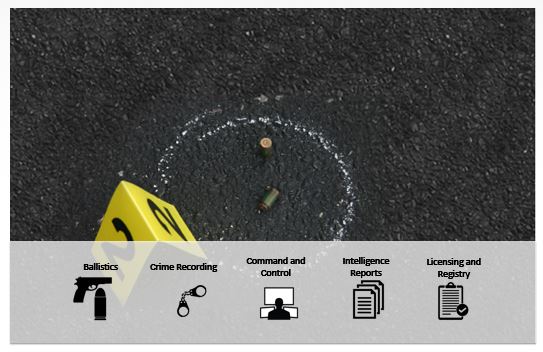
One point which was consistent throughout the event was Firearm Focal Points (FFPs). FFPs are designed to collect all the necessary firearm information together, creating accurate investigative leads thereby helping both investigators and prosecutors to tackle the problem at source.

Firearm Focal Point

Firearm Focal Point

FFPs work because of data collaboration. Analysis of ballistic evidence has advanced hugely but this information should not be analysed on its own. If a cartridge case is found at a location what other crimes have we seen in that area? Were there any ‘shots fired’ call outs at that time? We may know that the cartridge case comes from a particular type of firearm. What intelligence do we have about trafficking those types of firearms? If we are lucky enough to find or have a match to a particular firearm; who is it registered to? Is there any link to other crimes?

We can only answer these questions if we have access to all the information. Analysis tools allow us to understand this information quickly, helping FFP’s provide accurate leads fast. It was my job to showcase how analysis tools can aid investigations when this data is made available.

Arquebus and I worked together to implement the Kosovo FFP. The success of this deployment was collaborated by Kosovo Police, who also spoke at the conference. It was with great pride that I listened to real cases where the collaboration of ballistic and crime information had aided investigations.

Crime in Action

A unique feature of IFFS 2017 was the ‘Crime in Action’ simulation, which ran through the entire conference. Subject experts shared their experiences and expertise not only through presentations and interactive panel discussions but also as part of a ‘crime in action’ scenario.

IFFS

IFFS

It was great to see all of the skills and expertise employed in dealing with a live gun crime investigation, but also to see how areas such a legislation, policy making, joint working arrangements and international development all play a part in how we deal with gun crime and illicit arms trafficking.

The highlights for me were visiting a simulated gun crime scene and the final arrest which occurred in the middle of the conference, much to the surprise and delight of the delegates.

In summary, it was one of the best conferences I’ve attended and I hope to return either as a delegate or presenter in the future.

Analysing and understanding text

Library

Introduction

Large amounts of text can pose a challenge to analyse and understand. We keep generating more of it every day. This ‘unstructured text’ can be in documents, emails or social media posts. Indexing this text can help when searching for keywords, but what if you don’t know the keywords? What if you don’t know where to start?

This post describes some of the technology and techniques that are available. It focusses on free to use (but not to distribute) software. It will not focus on particular commercial software; although some products are mentioned.

The Data

royal_commission

Case Study 21

The data I’ve used for this is real. A case study from a public inquiry into Satyananda Yoga Ashram at Mangrove Mounting (Australia) for allegations of child sexual abuse. The allegations are made against a spiritual leader Akhandananda in the 1970’s and 1980’s with submissions from survivors, held in multiple documents.

https://www.childabuseroyalcommission.gov.au/case-studies/case-study-21-satyananda-yoga-ashram

WARNING: The content of these documents are disturbing. Reader discretion is advised. 

Natural Language Processing
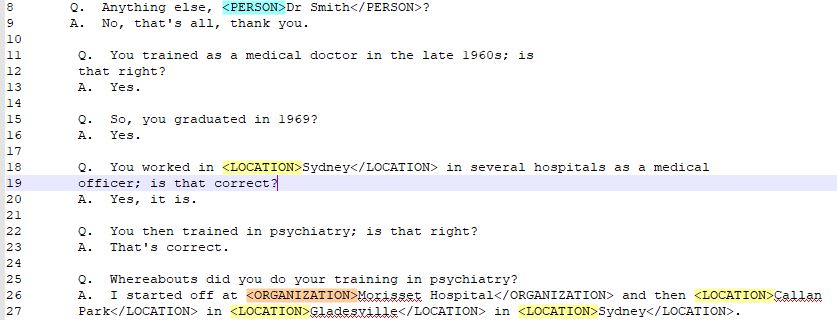
To help understand the data within these documents, I’ve first used Natural Language Processing (NLP). NLP allows machines to ‘read’ unstructured text. One of the ways NLP evaluates a document is: Named Entity Recognition (NER). NER gives an understanding of what entities (for example: people, organisations or locations) are present in the text.

Natural Language Processing

Natural Language Processing (NLP)

To demonstrate NLP I’ve used free software created by Stanford University. There are many other good commercial NLP products on the market offering various language/analytic capabilities.

Statistical Analysis

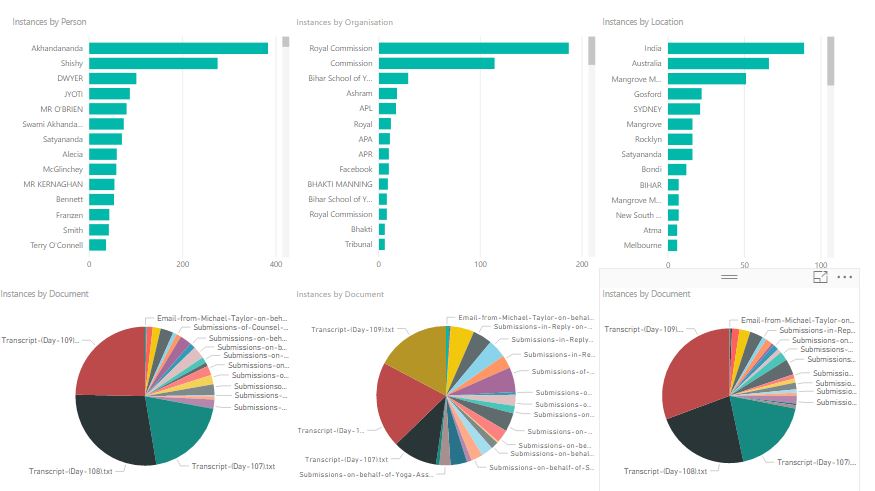
To give meaning to the results of the NLP I’ve summarised the documents and their contents dependant on the entity type. In this example, I’ve stuck with people, organisations and locations. Below is a statistical visualisation.

Statistical - PowerBI

Statistical – PowerBI

For each entity type, a count of occurrences is shown as well as document coverage. ‘Akhandananda’ is the person that has appeared the most times and the document ‘Transcript – Day 108’ contains the most people.

This basic visualisation was built very quickly using the free version of PowerBI. The free version allows you to create visualisations but limits the sharing options available. There are other good tools available for this kind of analysis, most offer free trials which is great if you want to compare functionality.

Visual Analysis

To take the analysis further I really needed to load the results into a database. I chose a graph database, simply because graph databases perform well with entity data such as people, organisations and locations.

For this example, I’ve loaded my data into Neo4j Community Edition which is free to use (under the GPL v3 license). If I was building something commercial which needed to scale then Neo4J offer commercial licenses as well.

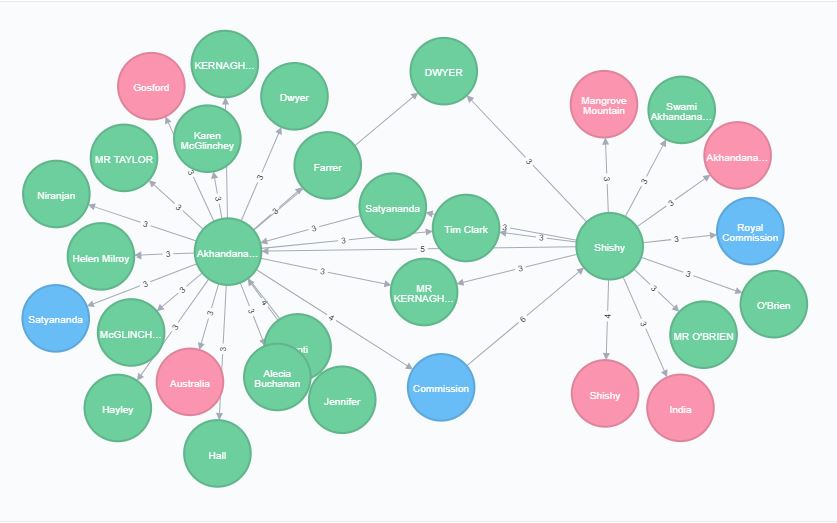
Once modelled, I could easily generate networks uncovering interconnecting entities within the data. The resulting visualisation is based on a short query. People are represented in green, organisations in blue and locations in pink.

Inquiry Network

Inquiry Network

Here we can see that Akhandananda and Shishy are key entities, mentioned alongside a lot of other entities. We can also see that Commission, Satyananda, Tim Clark, DWYER etc are linked to both Akhandananda and Shishy. These now become entities of interest.

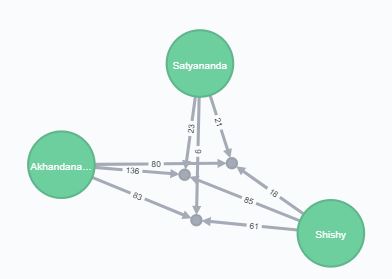
This gives a place to start. I first concentrated on Satyananda. Satyananda is a complicated entity as it’s the name of an individual and also the Yoga organisation. In this case, NLP has pulled out Satyananda the person. I used Neo4J to drill down into these entities, showing three documents that all entities were linked to. This time the numbers on the links refer to the occurrences of that entity in that document.

Document Network

Document Network

A quick look through those three documents soon shows Satyananda, Akhandananda and Shishy being mentioned together multiple times. The subject matter is disturbing, so I’ve chosen the text carefully. Below is a screenshot where Shishy is mentioning both Satyananda (as a person) and Akhandananda when being questioned.

Highlighted Text

Highlighted Text

Summary
Using a mixture of NLP, statistical and visual analysis tools allowed me to very quickly narrow down which documents and entities are of interest.

In truth, with a small dataset like this (under 40 documents) reading each document manually is another valid option. NLP is also not completely accurate and cannot fully replace the human touch. If faced with 1000 + documents then techniques like above can really help direct analysts to the key information.

This is a demonstration only and focusses on freely available tools. There are many commercial offerings that offer the functionality described above (and more) in one seamless application. If you are looking for fraud or crime in unstructured text then S-branch can help guide you to the appropriate products available.